You can conveniently monitor, at any time, how much heat your building consumes and how environmentally friendly it is in the Utilitas e-service.
In the Utilitas e-service, you can:
- see when the building consumes more or less heat than usual;
- compare how efficient your building’s heating system is to other similar buildings;
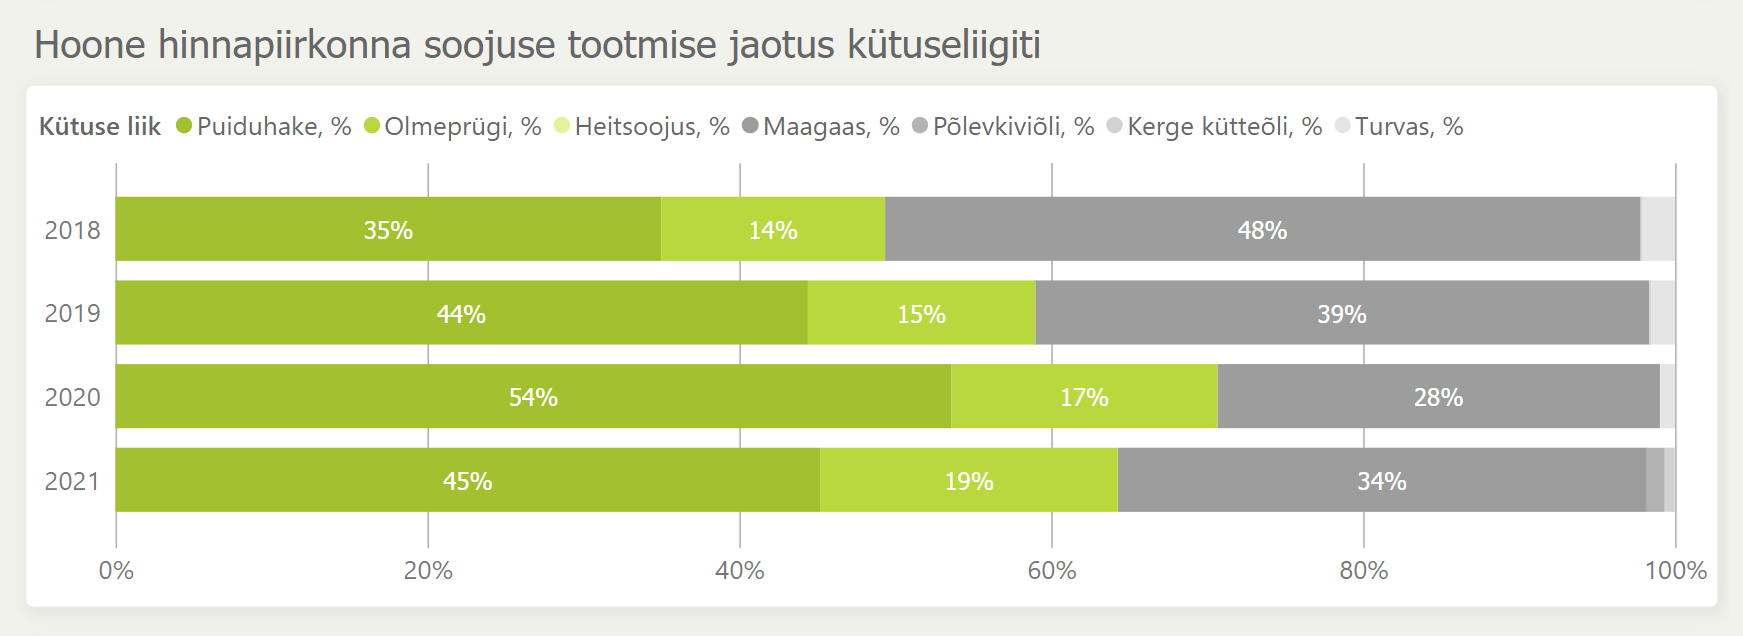
- see what type of fuels are used to generate the heat for your building;
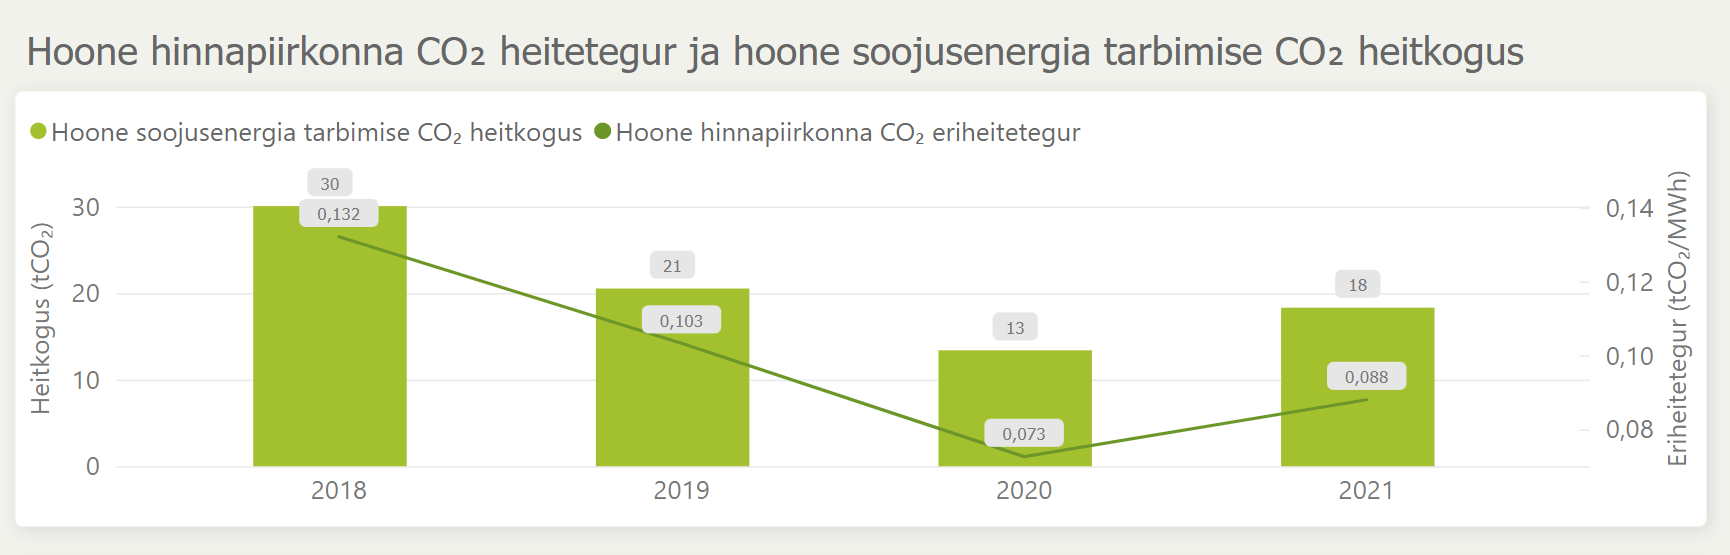
- see, how big your building’s carbon footprint is;
- send e-mails to Utilitas customer service;
- download invoices, etc.
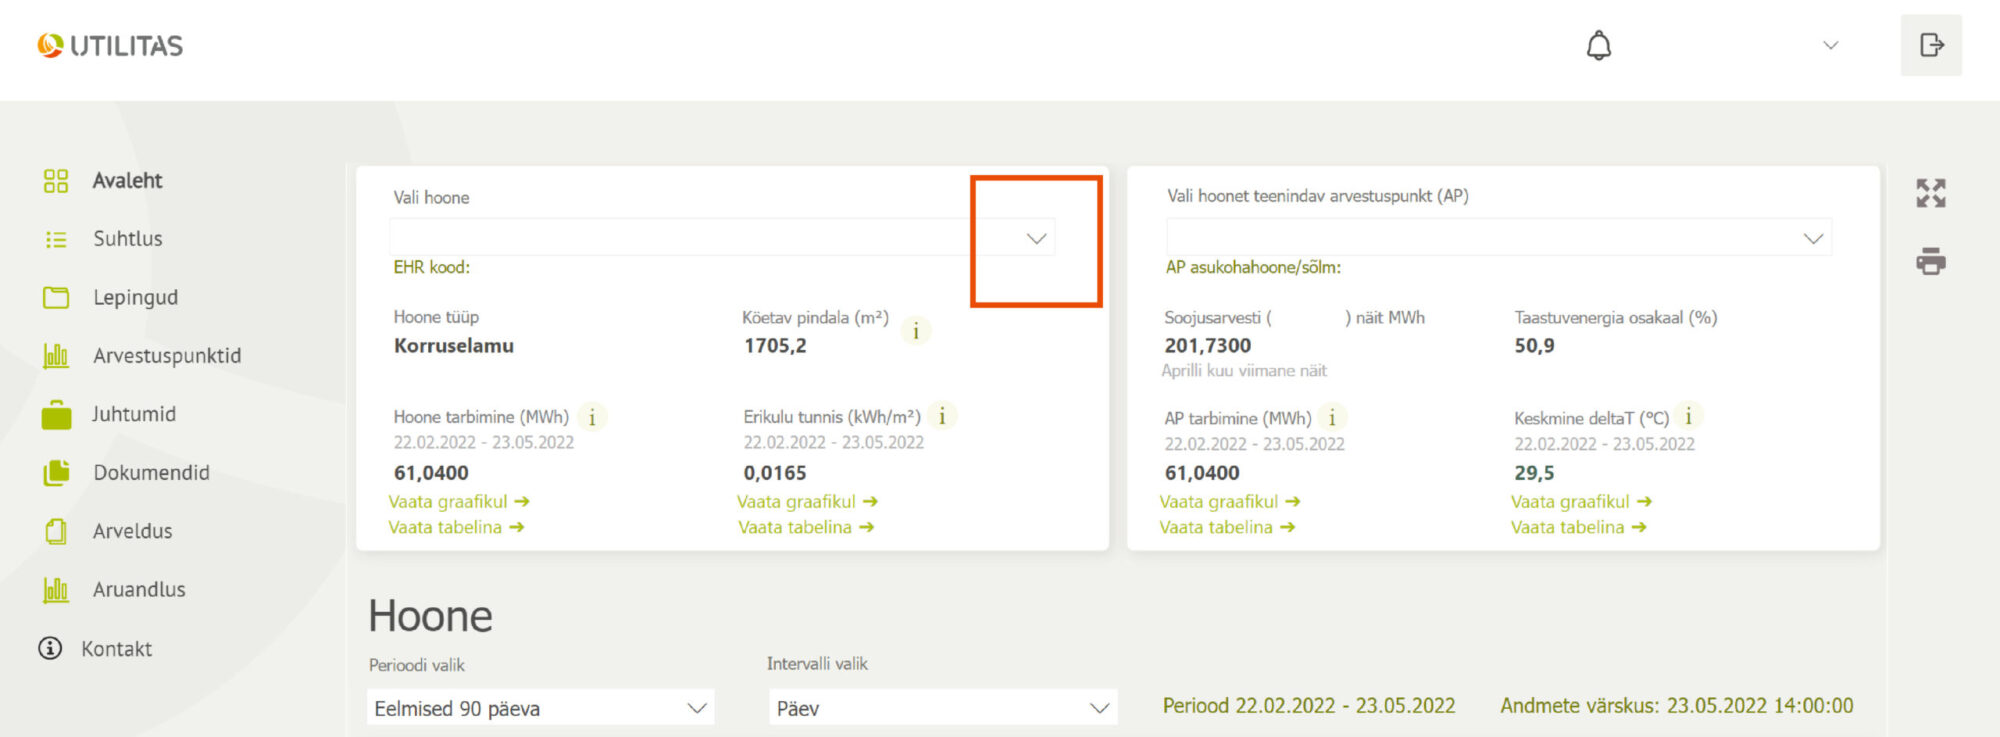
1. The self-service portal landing page contains information about your building: address, type, heated area, heat consumption, and other parameters.
2. If several buildings are connected to the Utilitas network, click on the building for which you want the data in the drop-down menu “Select building”.
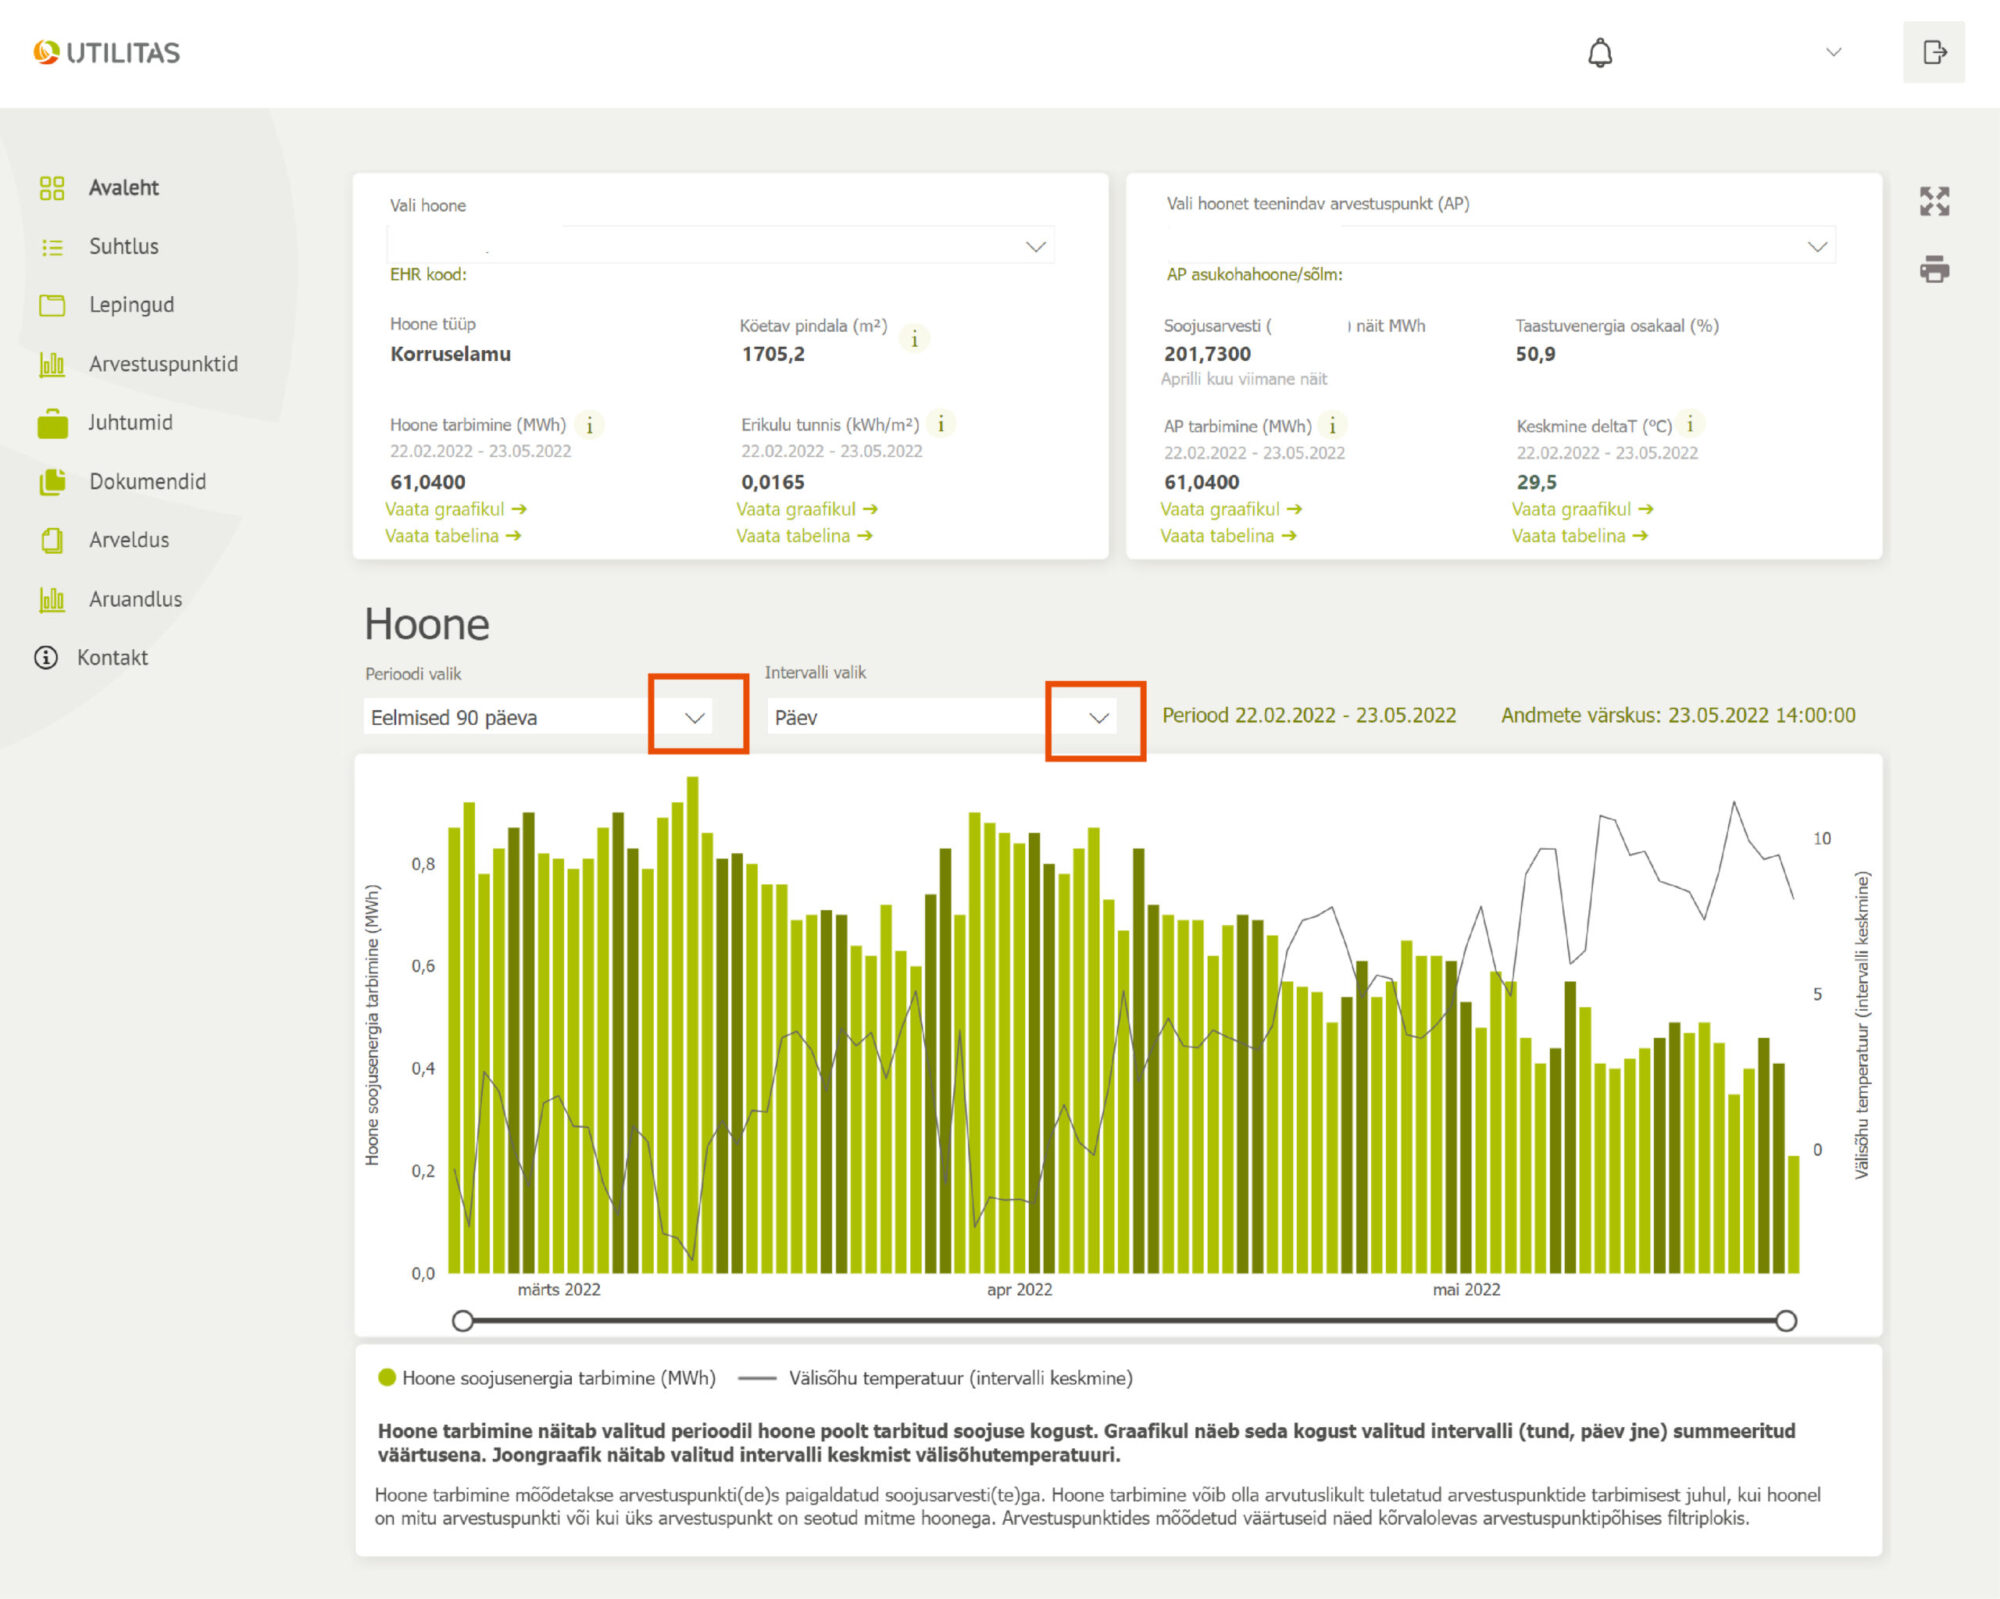
3. You can see the energy consumption of your building by different periods. To do this, click on “Period” and choose the time period that you want to see. From the graph, you can see consumption by year, month, day, and hour. To make a choice, click on “Interval selection” and choose the interval that suits you.
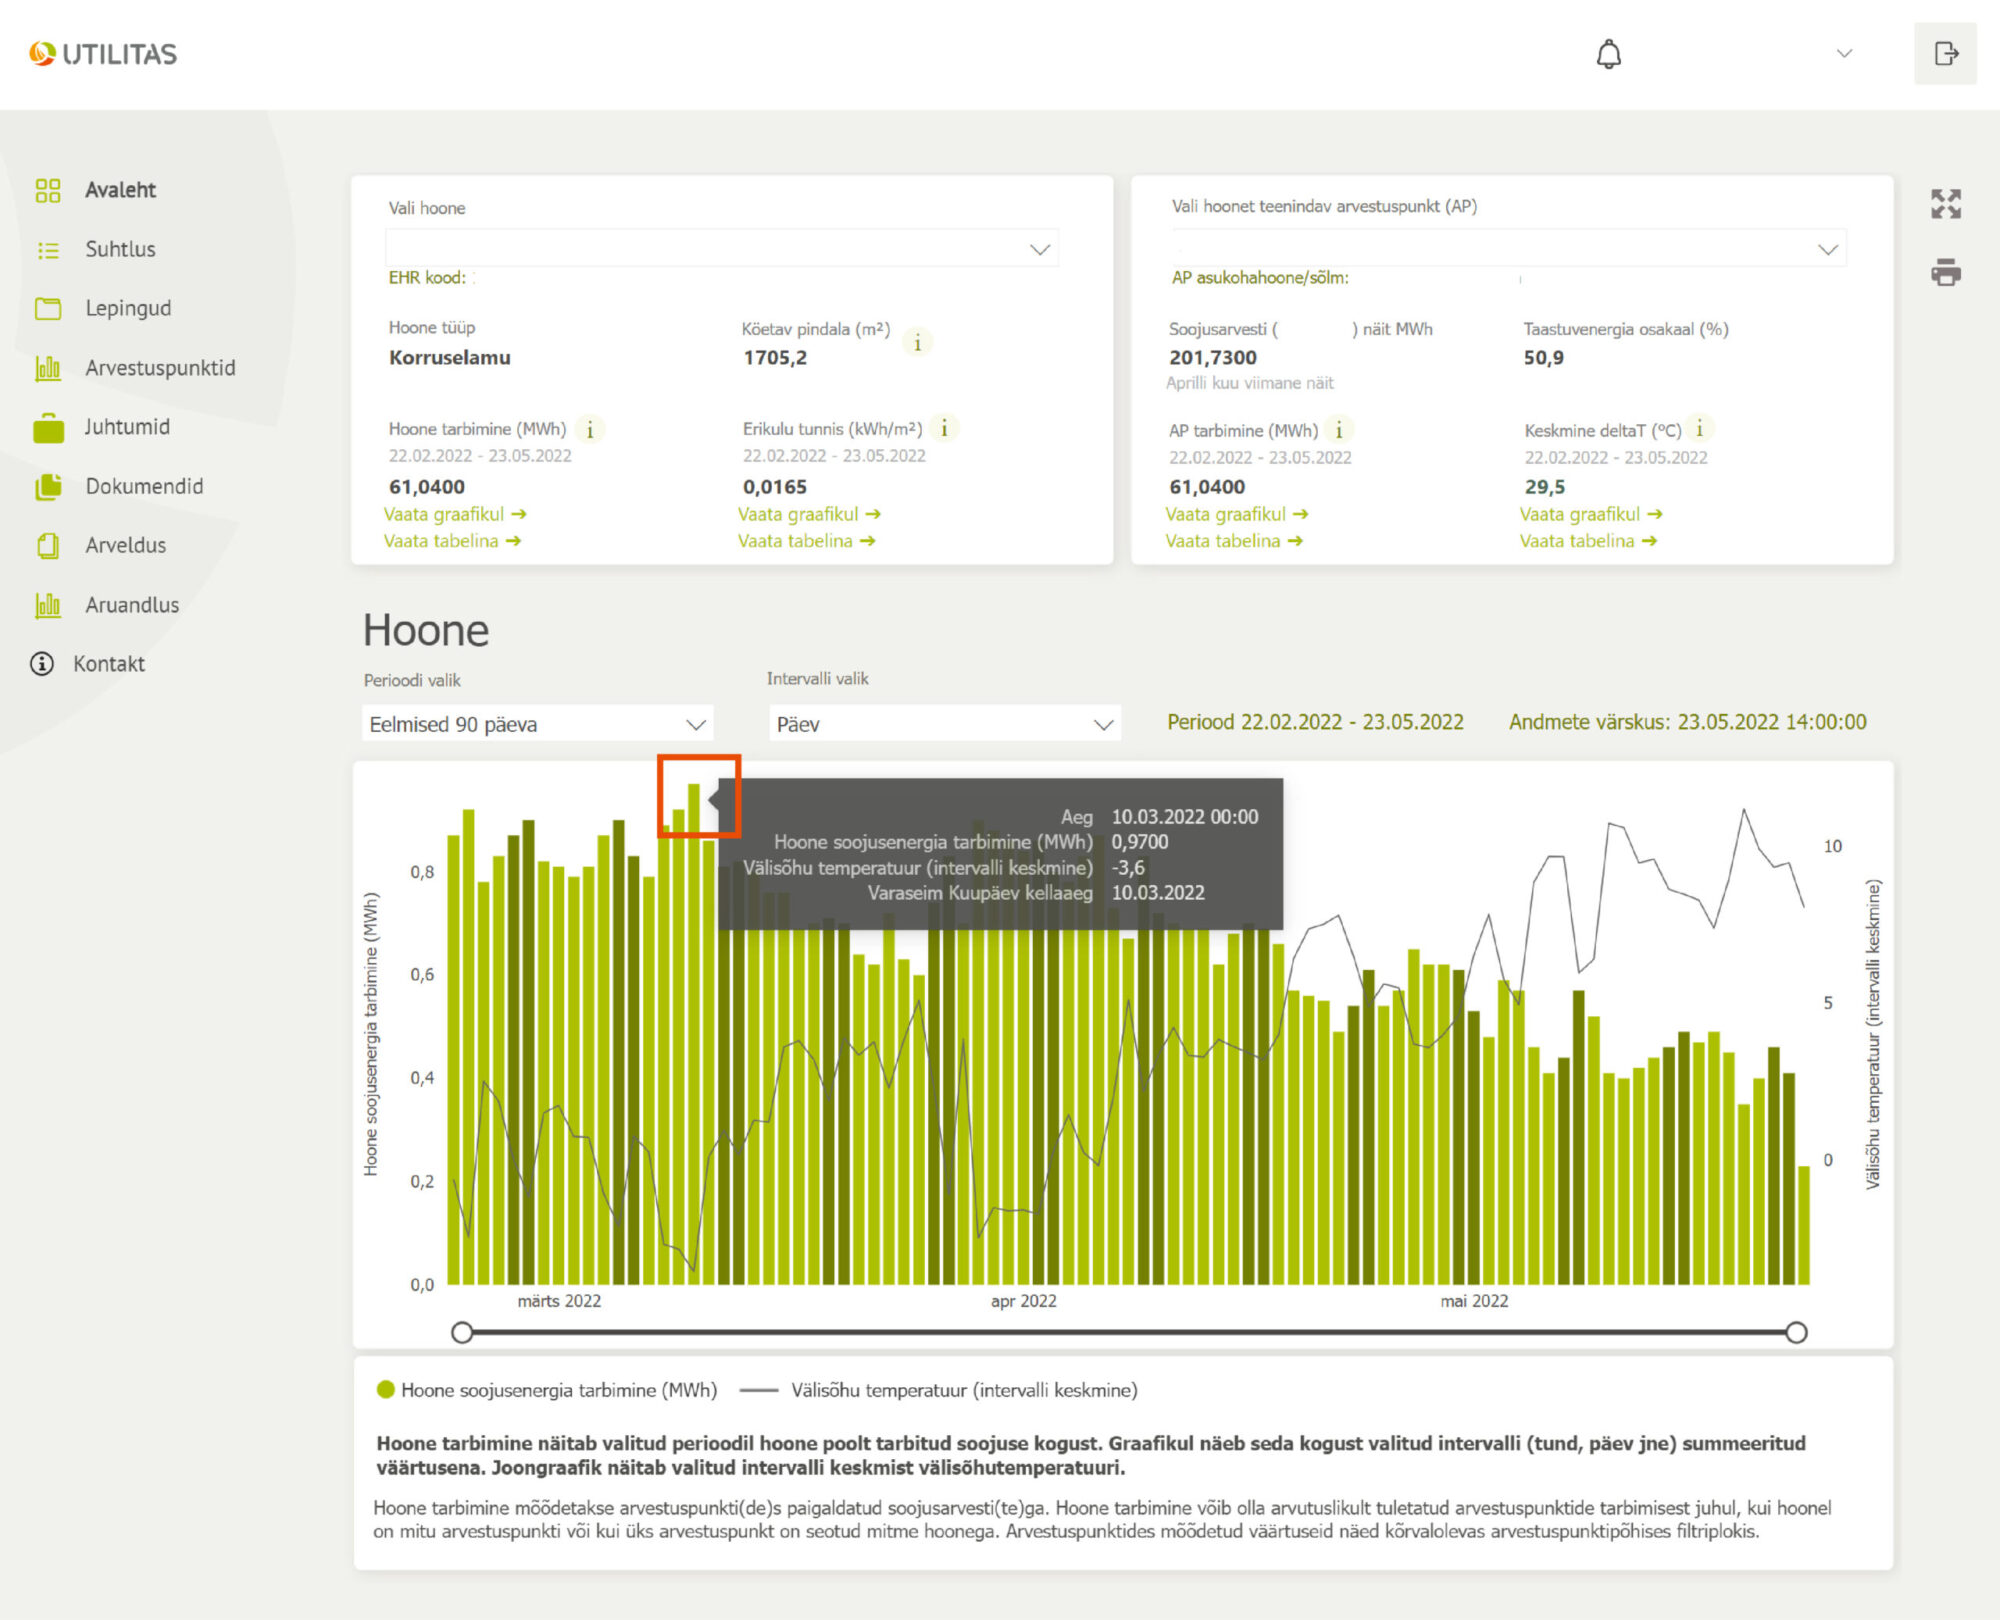
4. The highest graph columns show consumption jumps, i.e. when heat consumption increased sharply. If you move your cursor to the highest columns, you can see more detailed data about the jump.
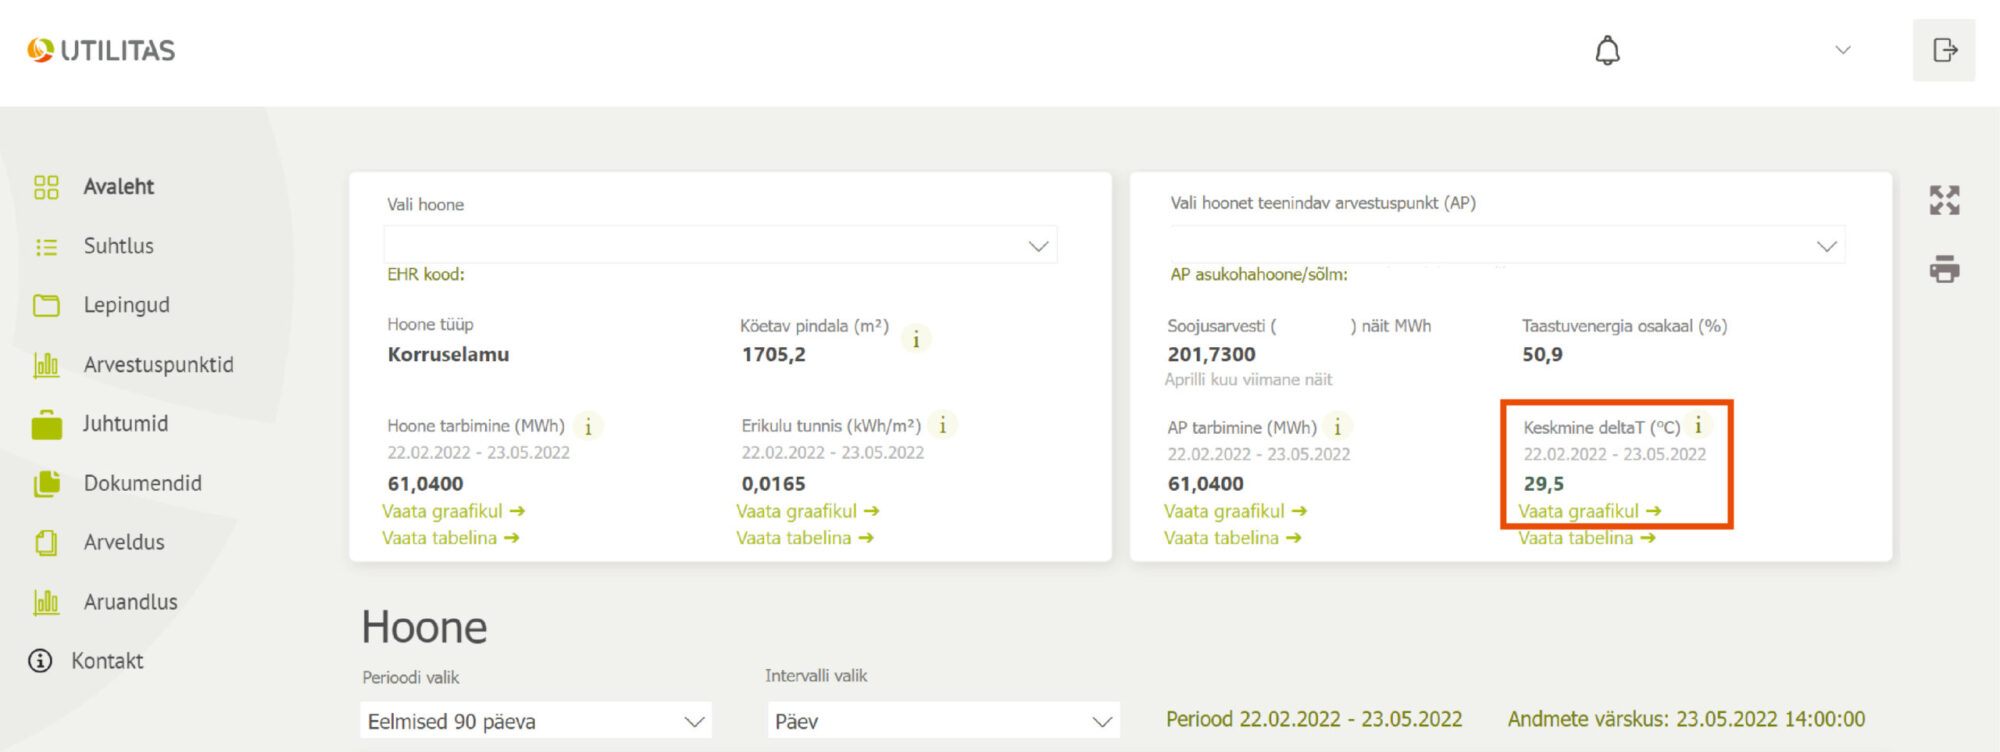
5. In addition, the e-service allows you to see the metering point (AP) parameters, which gives you a deeper understanding of the heating substation’s operation and automation settings.
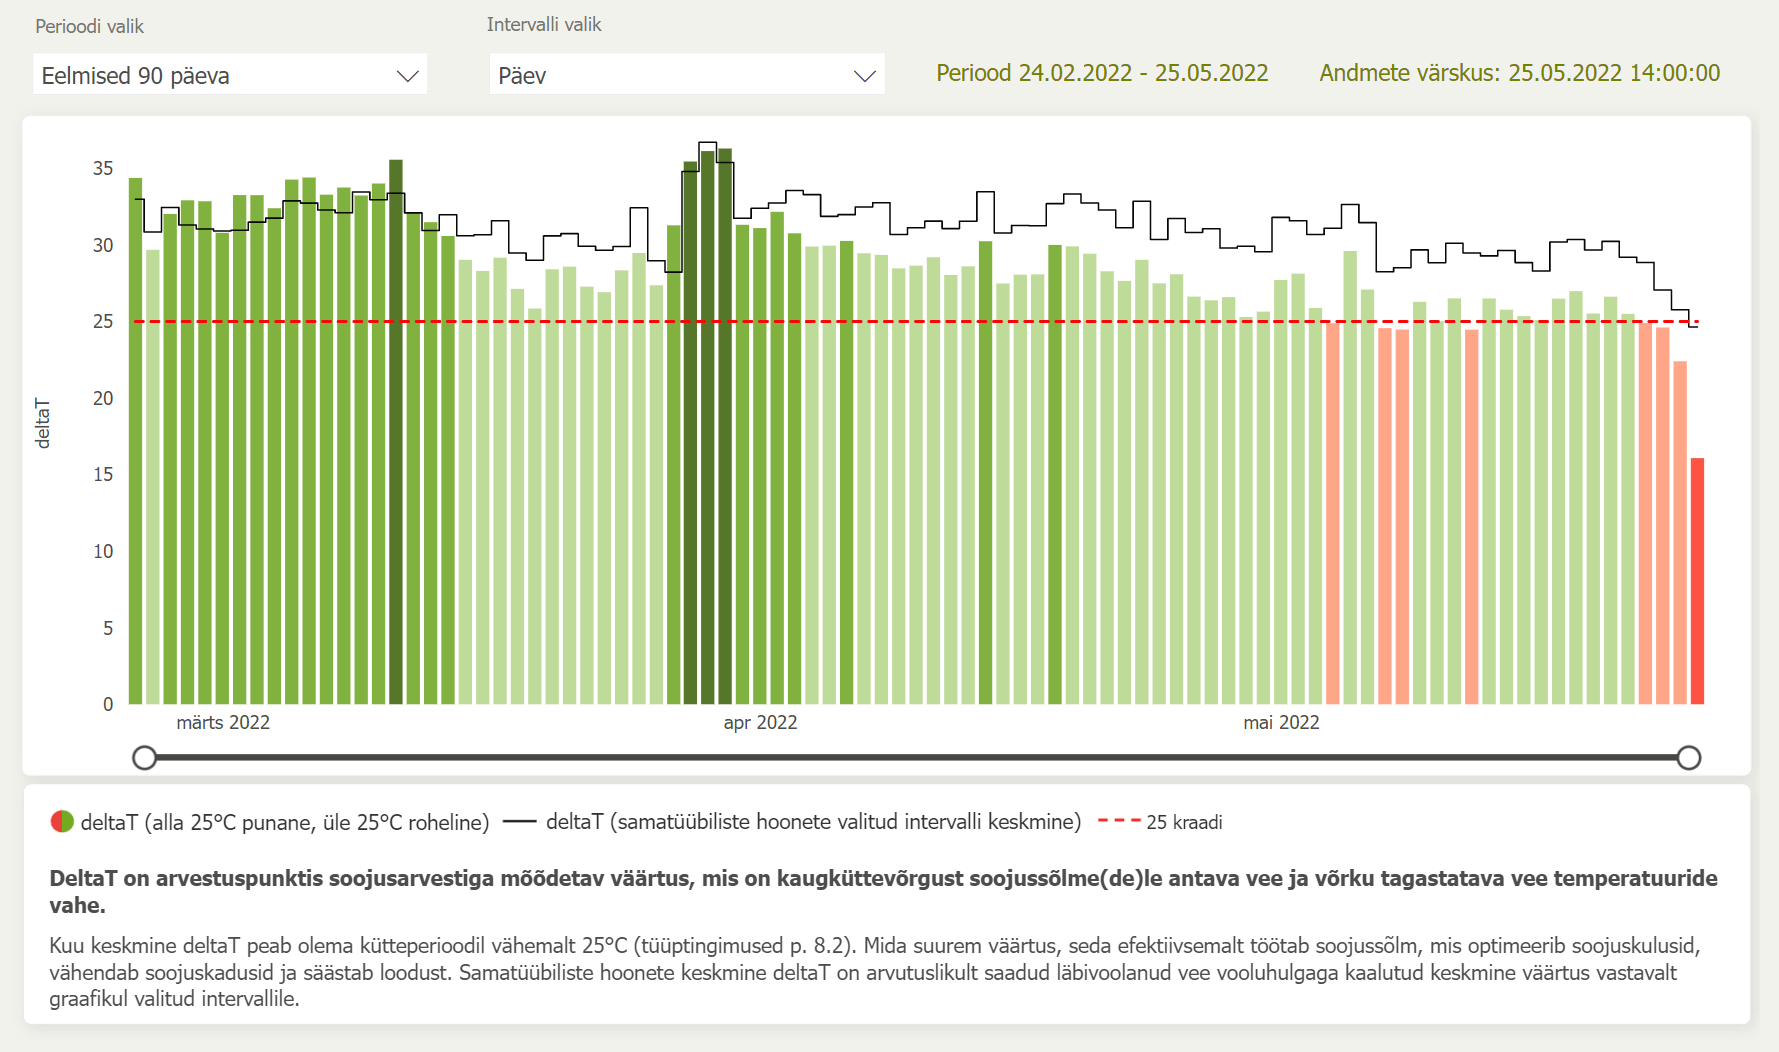
The higher the “Average Delta T” indicator, the more efficiently the heating substation works. An efficient heating substation saves costs, reduces heat loss, and saves nature.
The Average Delta T can also be viewed as a graph.
If the Delta T column on “View the graph” is below the red line, it indicates that the heating substation is not working efficiently and that it is necessary to investigate the problem.
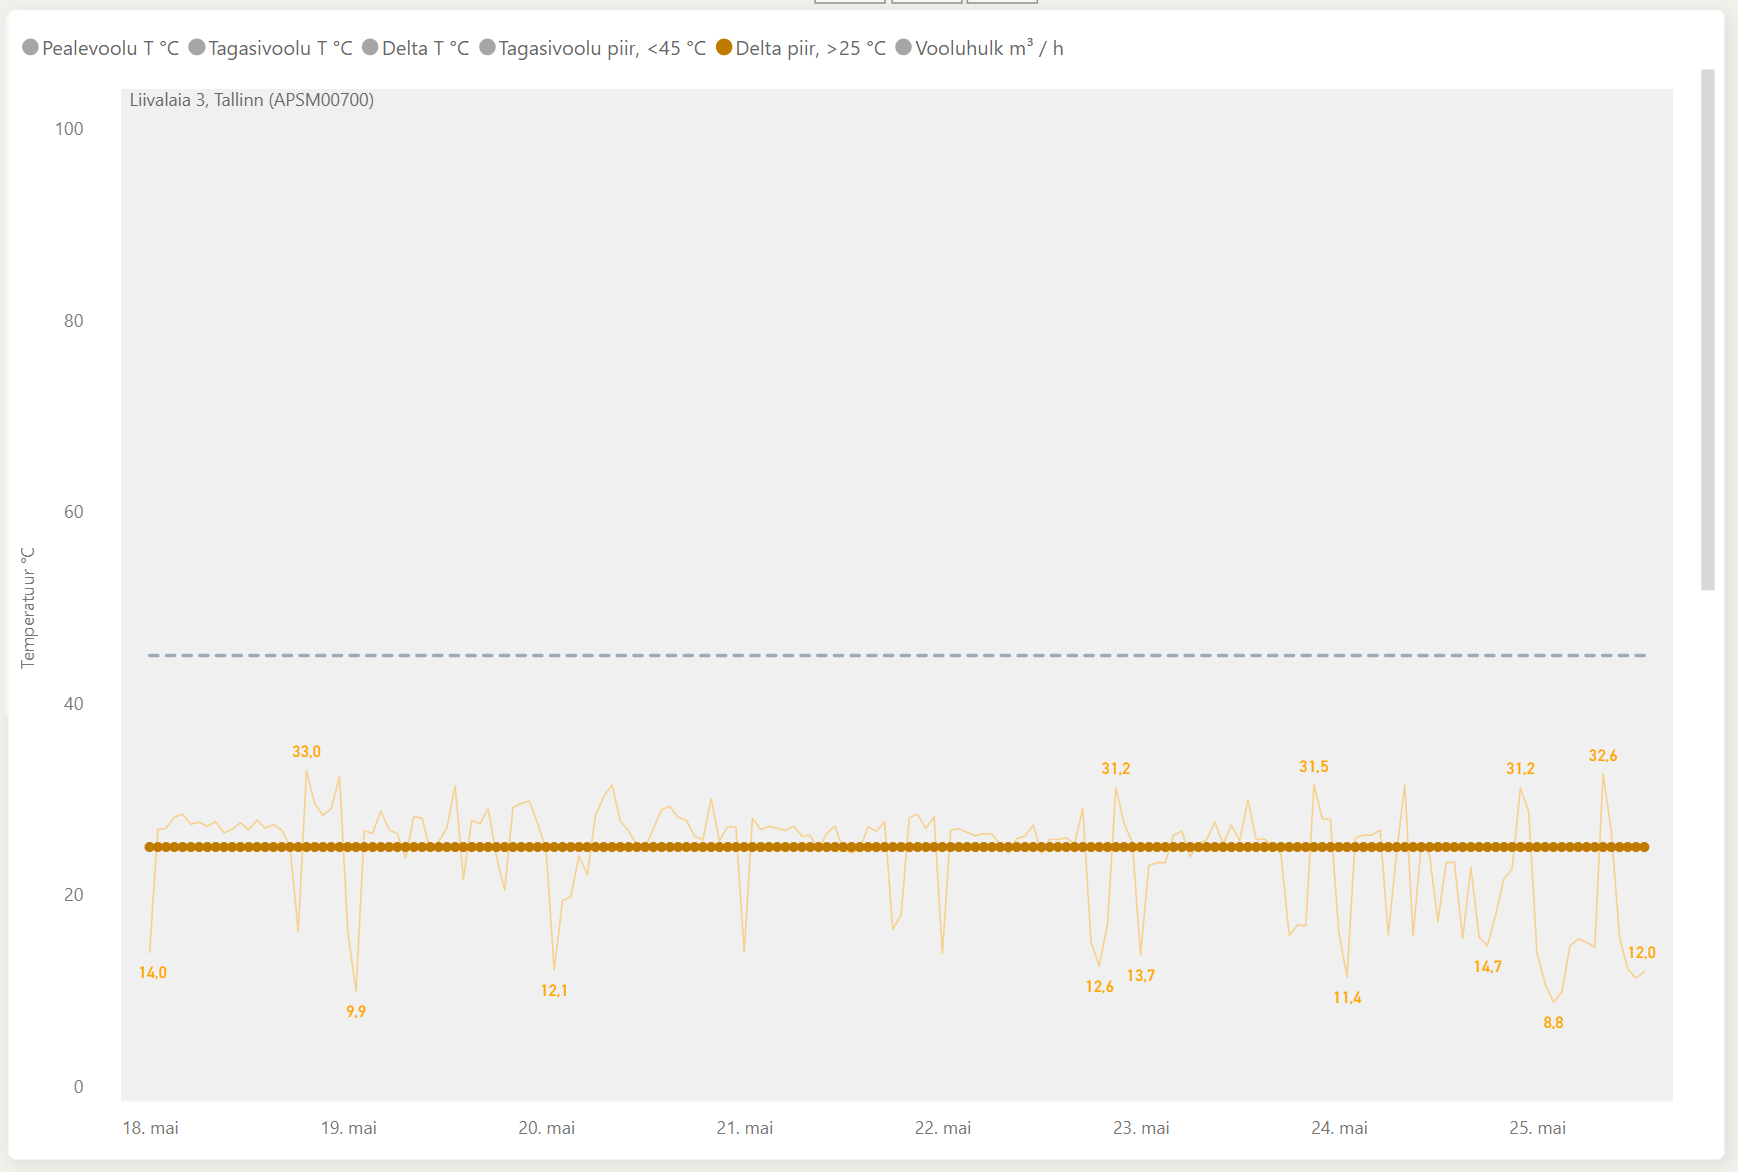
By selecting “Temperature and flow graphs of metering points” under “Reports”, the Delta T data can be seen even more precisely. If the Delta T graph is below the Delta T limits, this indicates that the heating substation is not working efficiently and needs to be repaired.
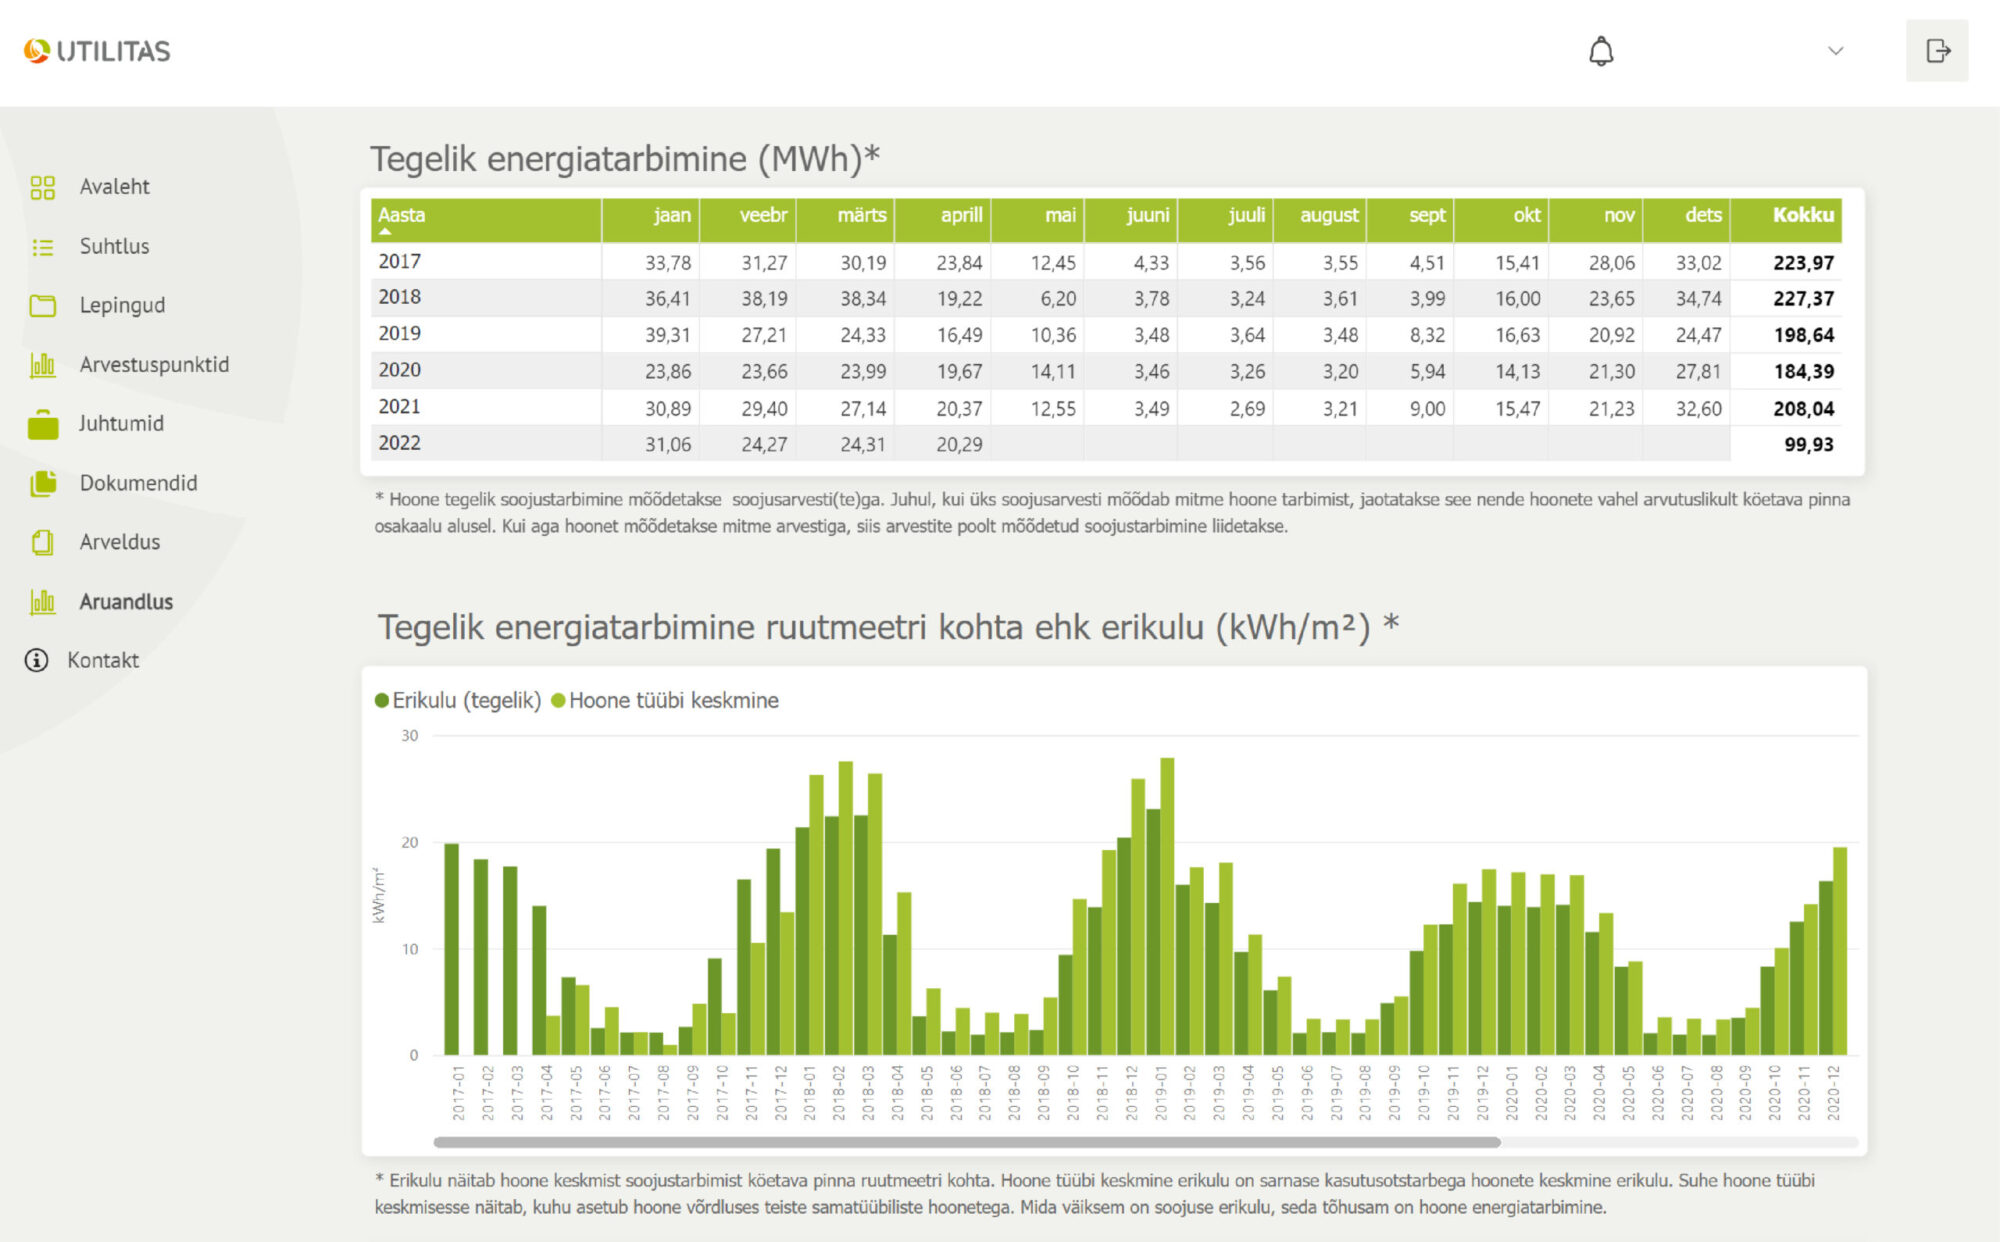
6. By selecting “Building heat consumption” under “Reports”, you can see the amount of energy consumed over time and the heat consumption per square meter. Thanks to these data, it is possible to compare the efficiency of the building’s heating system with other similar buildings.
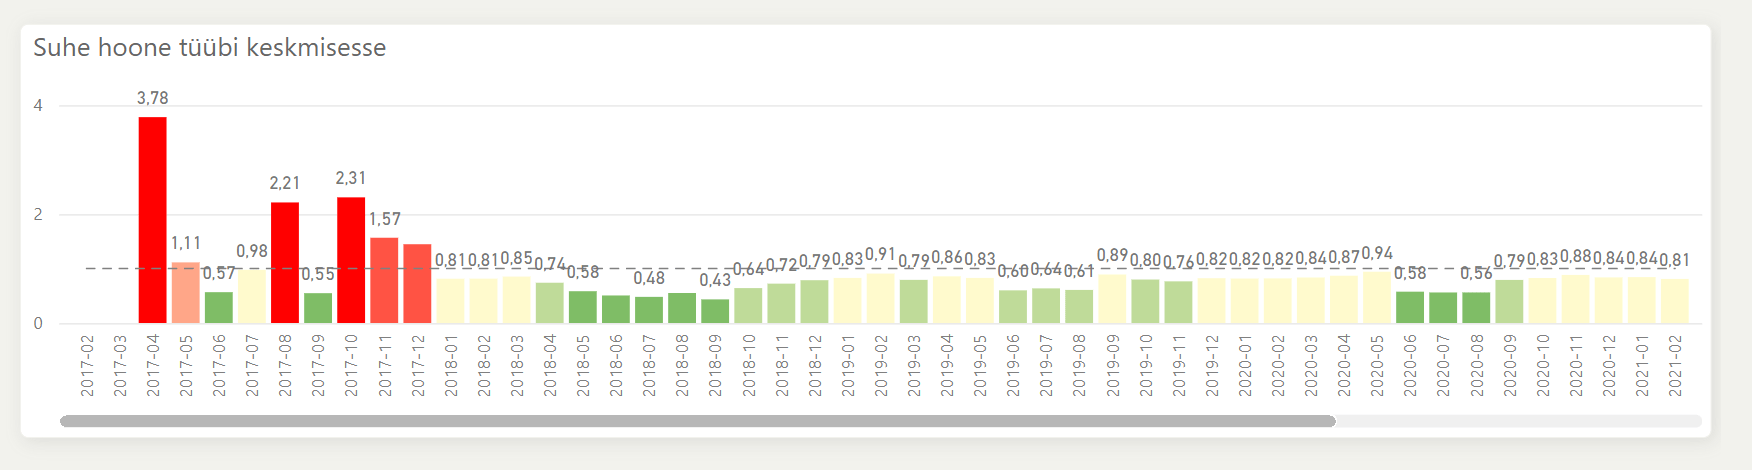
7. By clicking “Building heat consumption” under “Reports”, you can monitor how much heat your building consumes compared to other buildings of the same type.
8. By clicking “Used fuels and CO2-footprint” under “Reports”, you can see how big the carbon footprint of your building is and what kind of fuels are used to produce heat for the building.
Read more
Utilitas is the first Estonian company whose device was recognized by Elering as a manual frequency recovery reserve (mFRR) provider to meet...
The two-year-long fieldworks for bird surveys, which took place as part of the environmental impact assessment for the Utilitas Saare-Liivi offshore wind...
According to a survey conducted by Kantar Emor, the majority, i.e. 81%, of the Estonian population supports the wider use of wind...
“Tallinn’s development strategy for 2035 stipulates that the district heating system will produce heat from renewable sources only. The use of wastewater...

